
October 30, 2025
Ever wondered if those dramatic peaks and troughs in your GA4 data are part of a wider industry trend or just unique to your site? You can now know for sure with GA4's recently upgraded Benchmarking feature that, for the first time, allows you to compare absolute metrics like New Users and Total Revenue – not just percentages and ratios.


GA4’s Benchmarking feature received a game-changing upgrade this October – letting you compare absolute metrics like Sessions, New Users, and Total Revenue against your peers. Previously limited to normalised metrics like bounce rates and percentages, this update finally lets you see how your actual numbers stack up against the competition.
This is a great new feature that our team absolutely loves (pun very much intended). Before benchmarking, you either had to wait until the end of the year to see rough industry averages from various whitepapers, or manually compare data between clients in the same industry. Neither option was reliable – whitepapers covered too broad a timeframe to spot real trends, whilst client comparisons only gave you a limited sample size rather than true industry insights.
In comparison, with GA4 Benchmarking data updating every 24 hours, we finally have near real-time industry comparisons at our fingertips.
Why we love GA4 Benchmarking
GA4’s benchmarking feature provides reference metrics in percentiles (median, 25th, and 75th) based on peer groups of similar businesses. It offers two types of benchmark metrics – normalised metrics (like percentages and ratios) and unnormalised metrics (absolute numbers like “Total Revenue” or “Active Users”).
According to Google’s official benchmarking documentation, for absolute numbers, GA4 estimates a performance range based on your property’s number of active users by multiplying the peer group’s normalised metric by your property’s active user count.
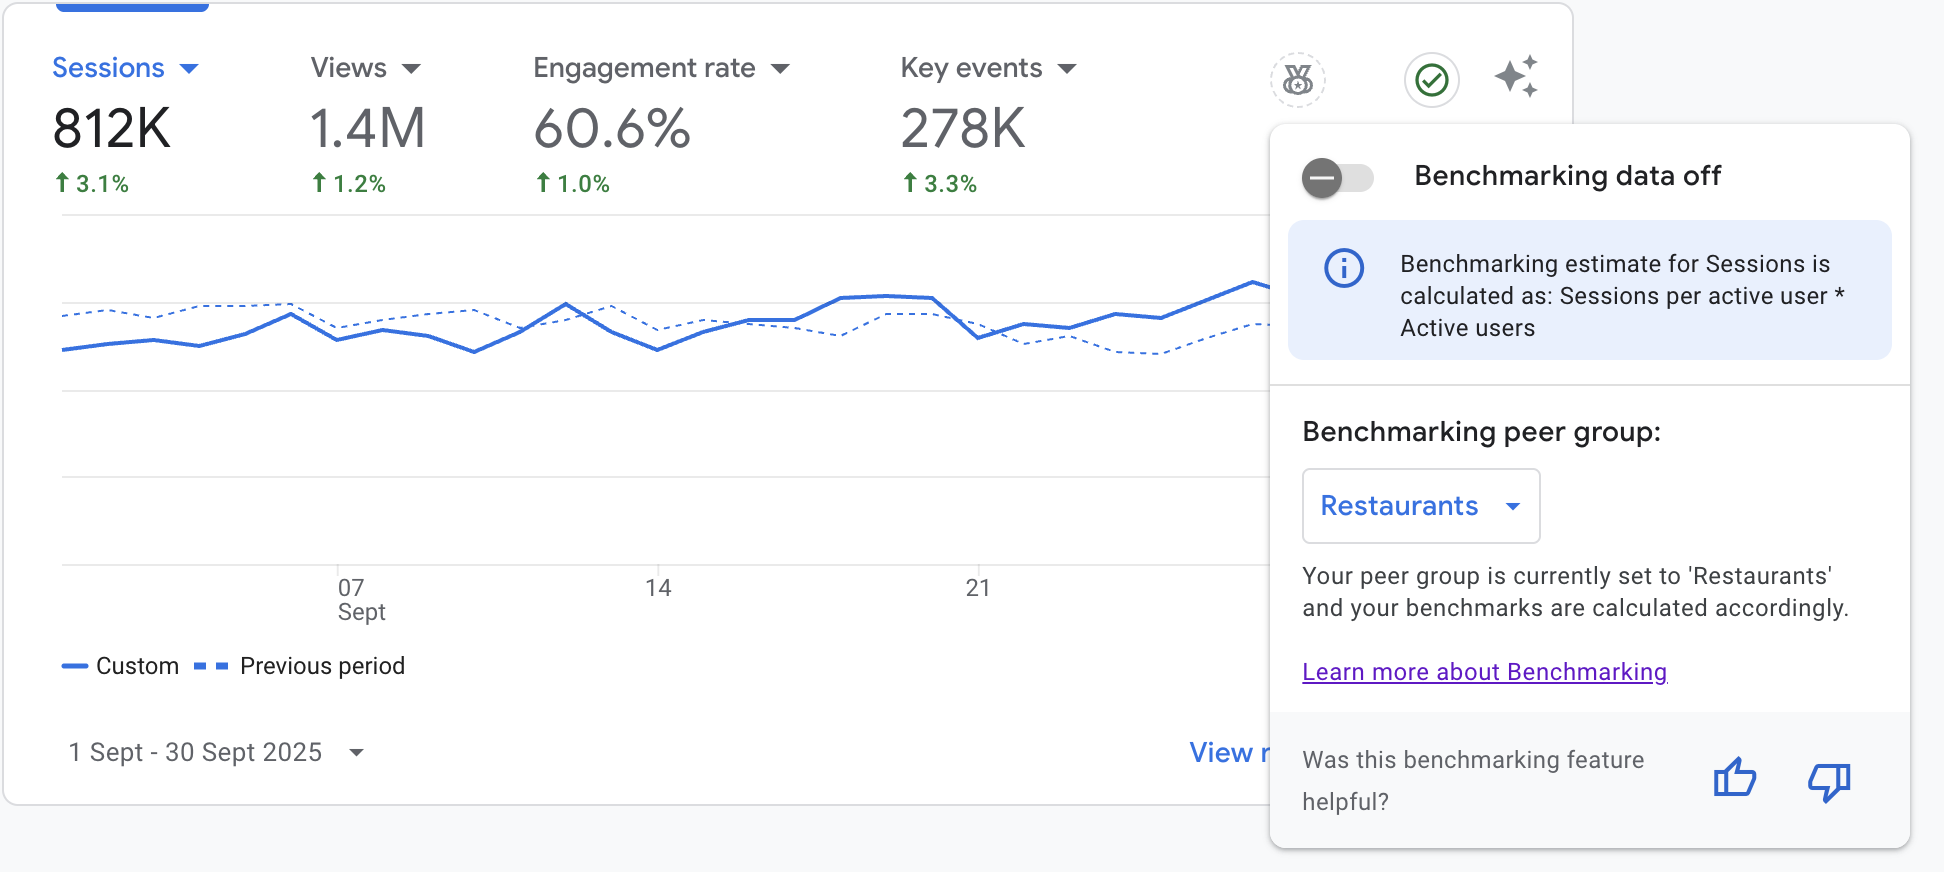
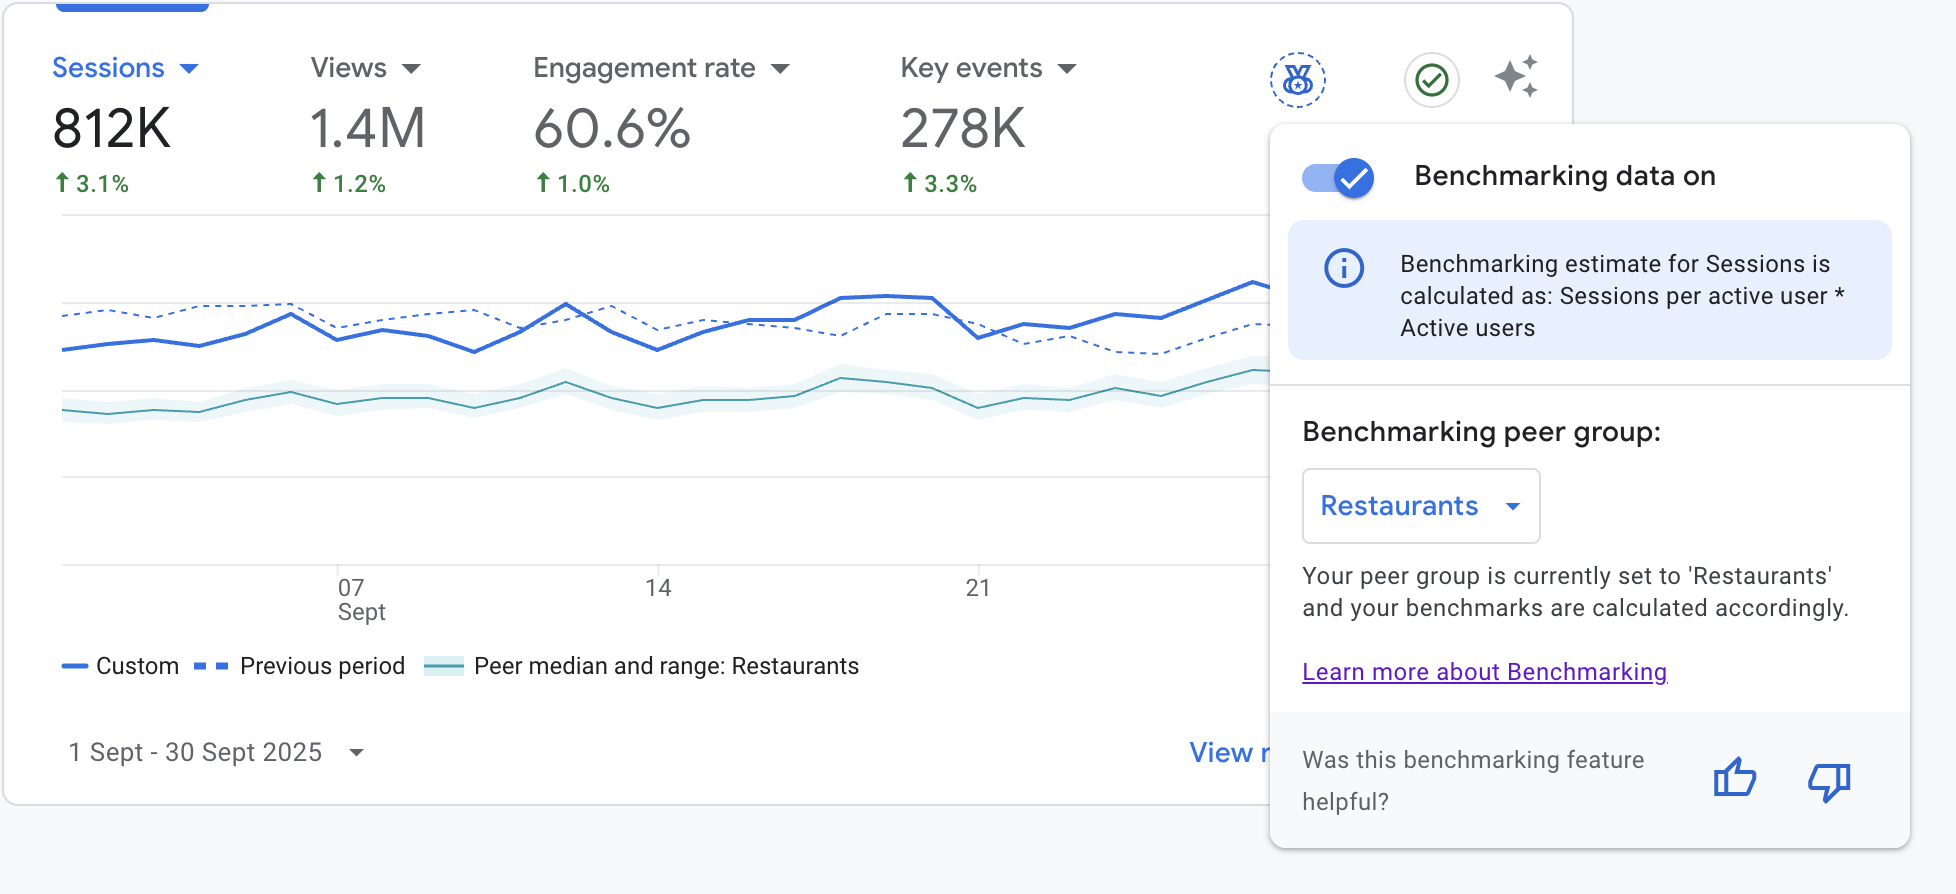
For example, the benchmark for Sessions is calculated as: Peers’ sessions per active user × Your active users
This ensures you’re comparing apples to apples, even when businesses have vastly different traffic volumes.
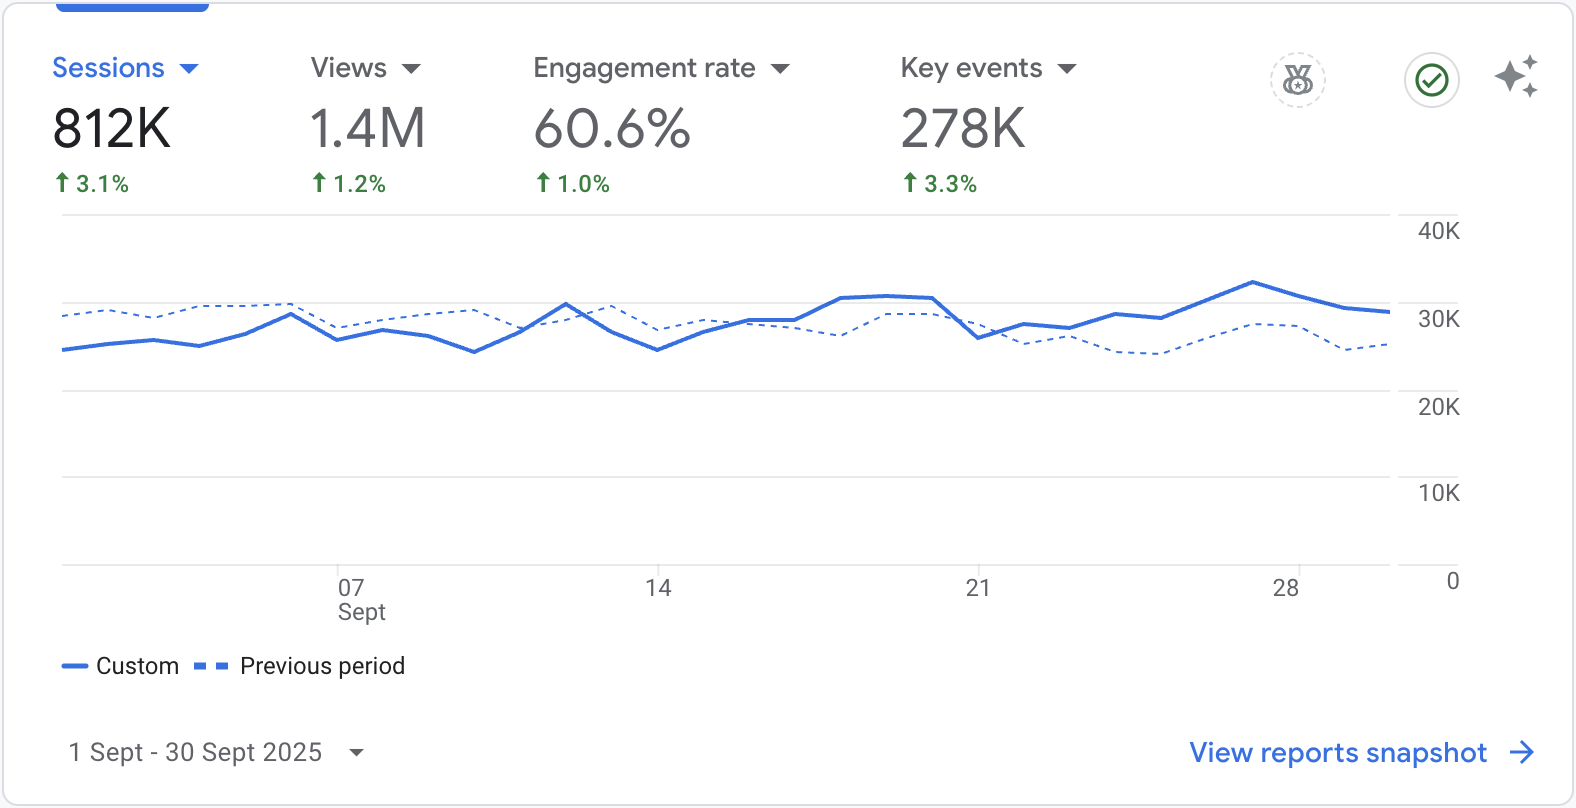
Step 1: Open Google Analytics and select the account then the property as usual. In the Home view, you can see the overview card with the four metrics you viewed last time and the Benchmarking icon.
Step 2: Click on the Benchmarking icon, then on the dropdown of industries to select your peer group.
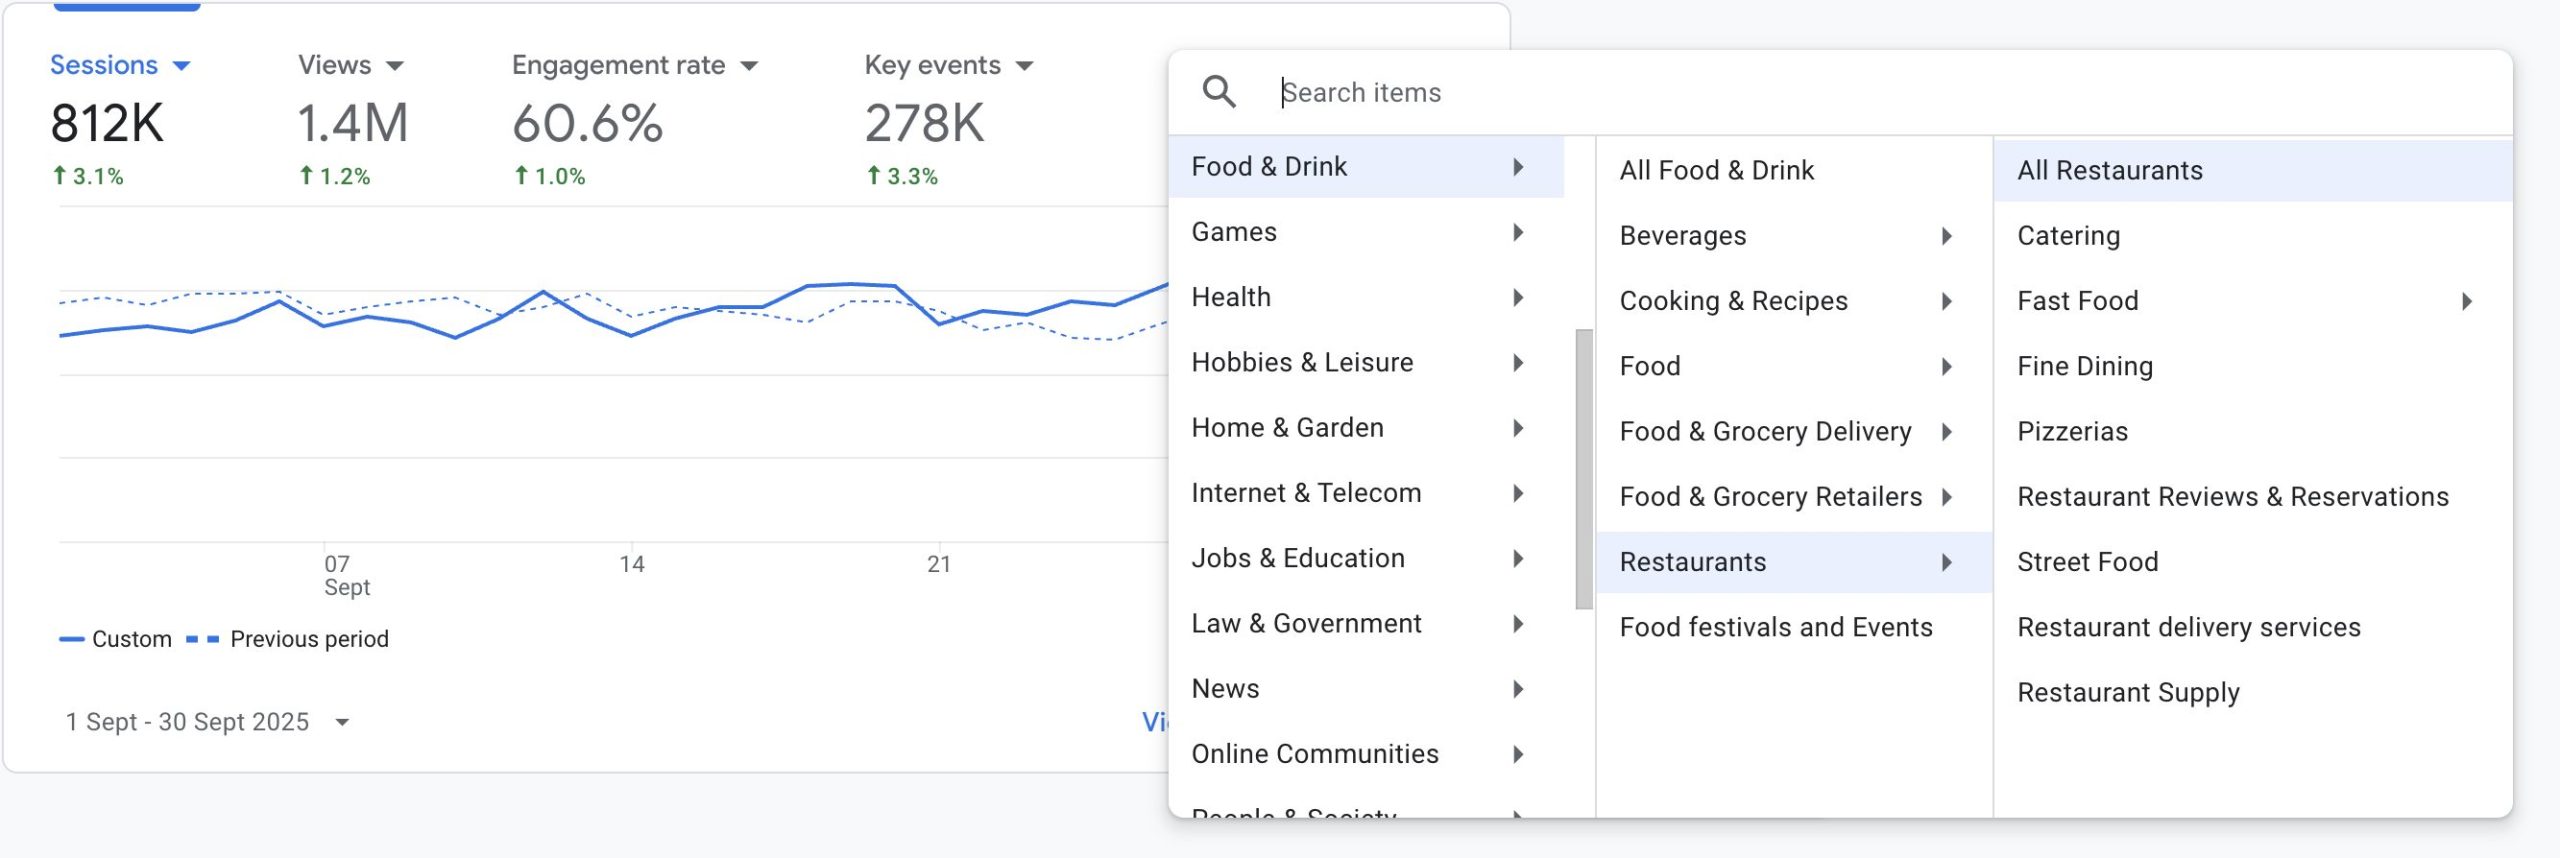
Step 3: Find the peer category that describes your industry most accurately.
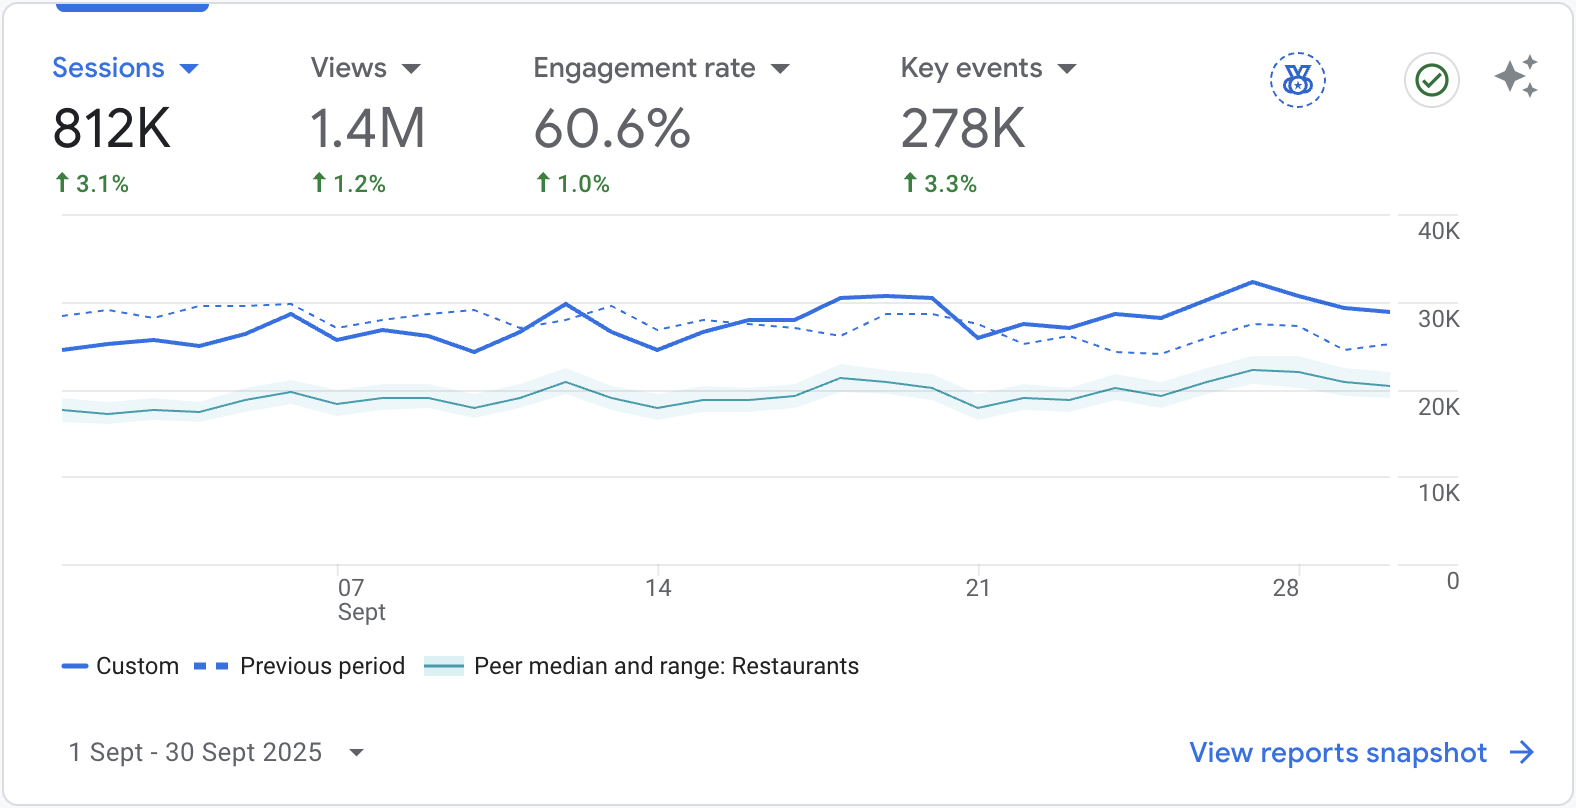
Step 4: Turn on Benchmarking to see the peer median (solid turquoise line) and peer range (light turquoise shaded area) for a quick visual comparison.
If you’re one of our clients, we’ve most likely already set this up for you. But as always, we encourage you to explore different features yourself. In this case, you could switch between different peer groups – for example, Restaurant → Fine Dining or even Cooking → Cuisines → Cuisine Type – to understand the overall interest in specific aspects of your industry.
If you’re a fellow digital marketing specialist, you’ll appreciate how this feature transforms client reporting. We now have realistic and comparable industry data. No more awkward conversations explaining why a 10% drop in traffic might actually be an industry-wide trend, or defending why a 15% increase isn’t as impressive as it sounds when competitors are seeing 30% growth. The data speaks for itself, adding invaluable context to every report and strategy discussion.
Benchmarking in GA4 is one of those features that once you start using, you’ll wonder how you ever managed without it. It adds context to every spike and dip in your data, turning guesswork into informed strategy. Give it a try – your next report will thank you for it.